I recently wrote a blog about an interesting graphic I saw in an article about iPad sales. (See Here) They took a bunch of information from a survey about iPads and created a visual chart of sorts to show the results. Apparently, these guys were just jumping on the bandwagon.
Over the course of the last week or so, I have had multiple exposures to the latest design trend……. The Infographic. Yes, thats right, it’s the latest art form. haha! Text creatively mixed with visuals is nothing new to advertising, we see it everyday. However, The Infographic, blends fact nuggets with related icons or images to create something very interesting. Say you have an advertisement showing numbers and stats. This is usually considered very boring and dull, but with a little bit of creative design, viewers are captivated by what they see. Instead of dismissing this information, they are actually entertained and mesmerized. Amazing!

Since I am a sports ‘o holic, when I hear the word “Stat” or “Statistics” my mind immediately goes to sports, especially Major League Baseball. Since baseball has been around forever and the rules largely unchanged, both old and current stats are comparable. That being the case, baseball statistics are very popular and often talked about. In fact, you probably can’t watch one episode of SportsCenter without hearing some ridiculous baseball stat that only the aforementioned Stat Monkey could come up with. Heard of the the recent film Moneyball starring Brad Pitt? It was based on a true story all about statistics and how they effected the game. Also, I recently read an article during the NBA playoffs, that shared how some tech savvy coaches were using statistical heat maps to help prepare their teams defensively. (image above & Link) Images were created (similar to a Doppler Radar) to show where the apposing teams were shooting higher percentages. The coaches then could help their players defend the oppositions “Hot Spots”. Stats do lend themselves to sports, but are expanding into other interesting advertising avenues.
So, text and letters be aware! Numbers are trending in the advertising world. If you want to see some of this in action, I recently found the infographic jackpot. www.InfoGraphicWorld.com While admittedly, it was sports articles from ESPN.com that led me here, I was surprised at the variety of corporations that are using them. After looking at several of them, I realized how effective info graphics can actually be. When you get done reading a good one, you feel like you have learned something. I found myself reading an info graphic that was comparing 5 other info graphics to see which was the best - and I was enjoying it! hahah!
So what does all of this have to do with you? Im just warning you. If you are a commercial/advertising nerd (like myself) be prepared to see a lot of stats, but be prepared to like them.
Should you find yourself in the need of a good info graphic, Let me know. I kind of want to work on one now. Below are a few links to some cool ones I found.
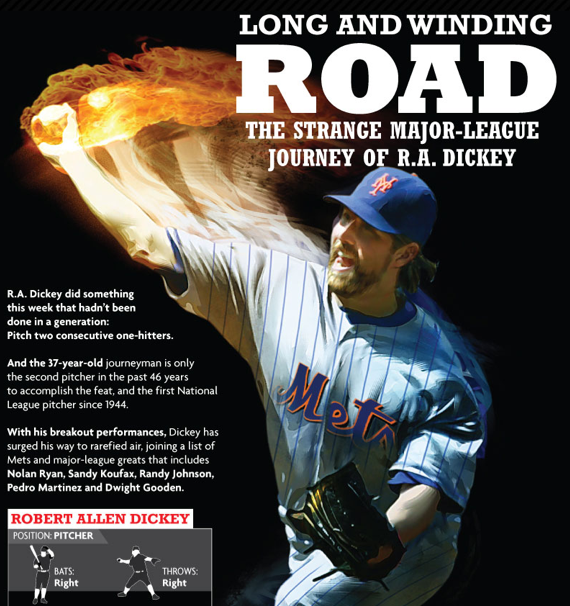
R.A. Dickey Info Graphic - He’s the New York Mets pitcher who should have started the 2012 All-Star game tonight. Truly an amazing story. And he climbed Mount Kilimanjaro for goodness sake.
Best Info Graphic of 2011
History of the NFL Draft
http://infographicworld.com/espn-infographic-nfl-draft/
UPDATE:
9.19.12 - Just found another really cool one, thought I would share.
Mobile Photography Infographic
UPDATE:
9.19.12 - Just found another really cool one, thought I would share.
Mobile Photography Infographic


No comments:
Post a Comment